
When working with data, one of the most important concepts to grasp is variance in statistics. Whether you’re analyzing test results, market trends, or scientific measurements, variance helps describe how spread out or clustered your data is. Without understanding variance, it’s difficult to interpret the reliability and predictability of a dataset.
In this article, we’ll explore what variance means, how it’s calculated, why it’s useful, and where it’s applied in real life.
What Does Variance Mean?
More specifically, it shows how much the individual numbers in a dataset differ from the average (or mean) of the data. A higher variance indicates that the data points are more spread out, while a lower variance means the data points are closely grouped around the mean.
For example, if you’re analyzing two classes with the same average test score, but in one class all students scored similarly while in the other some scored very high and others very low, the variance will be higher in the second class. This allows you to understand more than just the average—it shows how consistent or inconsistent the data is.
Importance of Variance
Understanding variance in statistics allows us to go beyond averages and get a clearer picture of data. Averages can sometimes be misleading if there is a wide range of values. Variance helps detect inconsistencies, outliers, and trends.
See also: Why China Remains the Leading Aluminum Supplier
Here are several reasons why variance is important:
- Identifies data dispersion: Helps us see how spread out data is.
- Supports risk analysis: In finance, high variance might signal unpredictable investments.
- Helps in quality control: Manufacturing processes need low variance to maintain product consistency.
- Assists in scientific experiments: Scientists analyze variance to assess the reliability of results.
Key Terms to Know
Before diving into calculations, it helps to understand a few basic terms:
- Squared Deviation: Each deviation is squared to remove negative values.
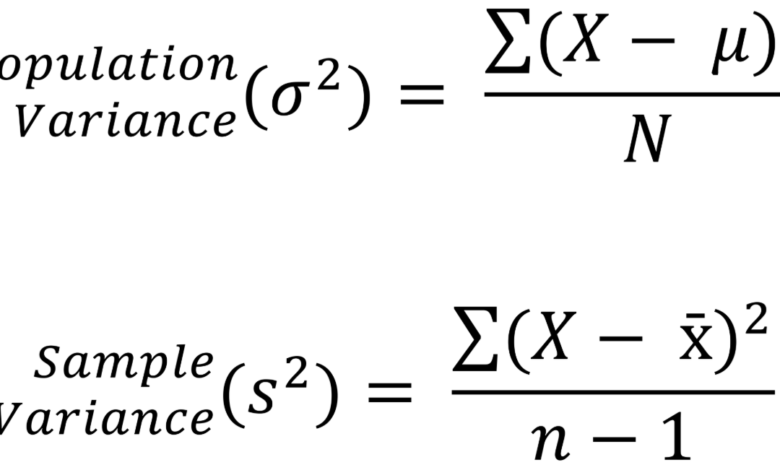
- Population vs. Sample: Variance can be calculated for both entire populations and smaller samples. The formulas differ slightly.
Population Variance (σ²):
σ2=1N∑i=1N(xi−μ)2\sigma^2 = \frac{1}{N} \sum_{i=1}^{N}(x_i – \mu)^2
Where:
- σ2\sigma^2 = population variance
- NN = total number of values
- xix_i = each individual data point
- μ\mu = population mean
Sample Variance (s²):
s2=1n−1∑i=1n(xi−xˉ)2s^2 = \frac{1}{n – 1} \sum_{i=1}^{n}(x_i – \bar{x})^2
Where:
- s2s^2 = sample variance
- nn = number of sample data points
- xˉ\bar{x} = sample mean
Step-by-Step Example
Let’s say we have the following dataset representing the number of books read by five students in a month:
3, 5, 7, 5, 6
Step 1: Calculate the Mean
(3+5+7+5+6)/5=26/5=5.2(3 + 5 + 7 + 5 + 6) / 5 = 26 / 5 = 5.2
Step 2: Subtract the Mean from Each Value (Find Deviations)
- 3 – 5.2 = -2.2
- 5 – 5.2 = -0.2
- 7 – 5.2 = 1.8
- 5 – 5.2 = -0.2
- 6 – 5.2 = 0.8
Step 3: Square Each Deviation
- (-2.2)² = 4.84
- (-0.2)² = 0.04
- (1.8)² = 3.24
- (-0.2)² = 0.04
- (0.8)² = 0.64
Step 4: Add the Squared Deviations
4.84+0.04+3.24+0.04+0.64=8.84.84 + 0.04 + 3.24 + 0.04 + 0.64 = 8.8
Applications of Variance
1. Education:
Teachers use variance to assess how evenly students are performing in tests. A small variance indicates consistent scores, whereas a large variance may highlight a gap in understanding.
2. Finance:
Investors calculate variance to measure how much a stock’s price fluctuates. Higher variance typically suggests higher risk.
3. Healthcare:
Researchers study variance in patient responses to treatments to determine the effectiveness of a drug.
4. Sports:
Coaches analyze player performance variance to assess consistency and reliability during games.
5. Business Forecasting:
Variance is used in demand prediction models to identify how uncertain or consistent customer behavior may be over time.
Variance in Real-World Decision Making
Understanding variance in statistics helps individuals and organizations make better decisions:
- A company assessing employee productivity will use variance to see who’s over-performing or underperforming.
- A data analyst might study the variance in website traffic to adjust marketing strategies.
- Governments might look at income variance across regions to develop fair taxation or welfare systems.
In all cases, variance gives context to the data and supports more accurate conclusions.
Challenges and Limitations
Even though variance is a valuable tool, it has limitations:
- Sensitive to Outliers: One extreme value can significantly affect variance.
- Assumes Normality: Variance is more meaningful in normally distributed datasets.
It’s important to use variance alongside other tools such as median, range, and standard deviation for a comprehensive understanding.
Conclusion
In statistical analysis, variance is one of the most informative measures for understanding data behavior. It tells you how much the values in your dataset deviate from the mean and offers insight into the consistency, predictability, and reliability of your data. Whether you’re a student, a professional, or a researcher, mastering the concept of variance in statistics can greatly improve your ability to interpret and work with numbers effectively.
By learning how to calculate and apply variance, you gain access to a deeper layer of data analysis—one that empowers smarter decisions and more accurate conclusions in any field of work.
